
Why RTX 50 Hotspot Monitoring Matters More Than You Think
RTX 50 hotspot temperature monitoring is the process of reading the hottest sensor on an Nvidia RTX 50-series GPU, which often sits far above the average core temperature and is essential for spotting thermal throttling, poor cooling contact and bad thermal interface material before your card silently slows down or degrades over time. If you own any RTX 50 card and care about performance, overclocking or long-term reliability, this is worth enabling. The caveat: Nvidia chose not to expose hotspot telemetry through its public Windows API on Blackwell GPUs, so out-of-the-box tools will only show a much lower "GPU temperature" that can look fine while your card is cooking. That mismatch is how an RTX 5070 Ti could report just 67–68°C while secretly hitting 107°C at the hotspot and throttling immediately under load.
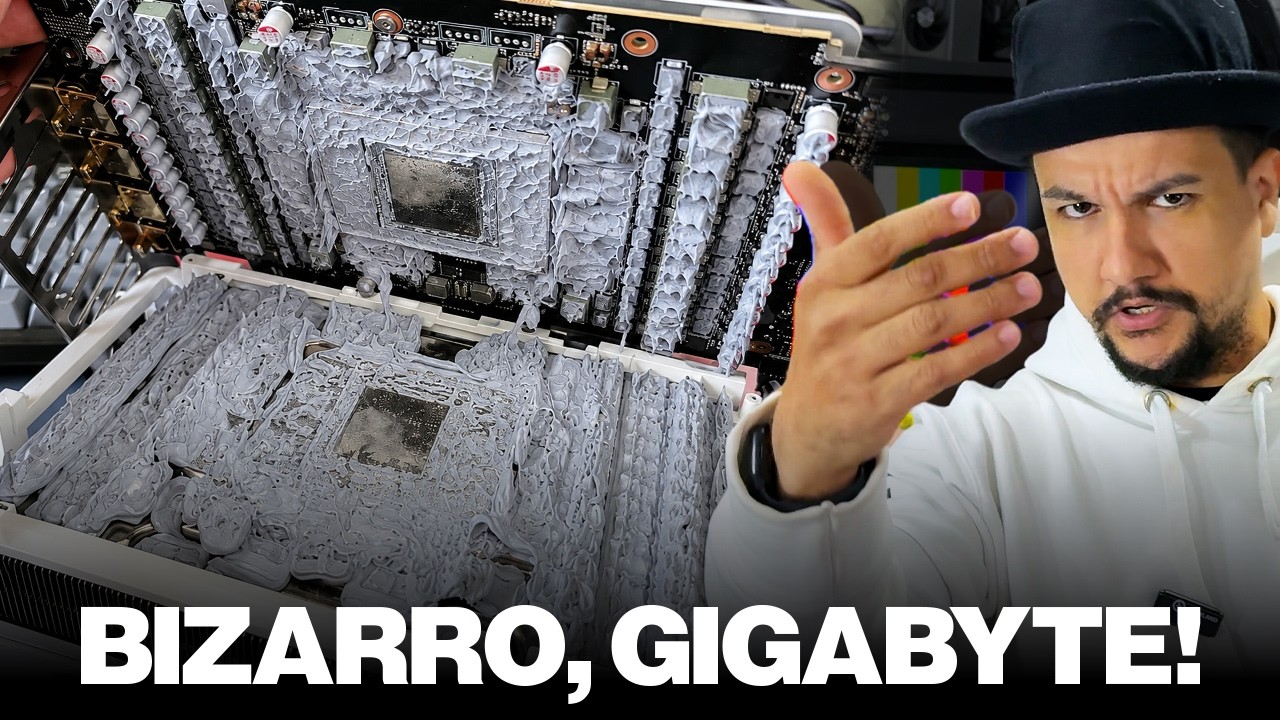
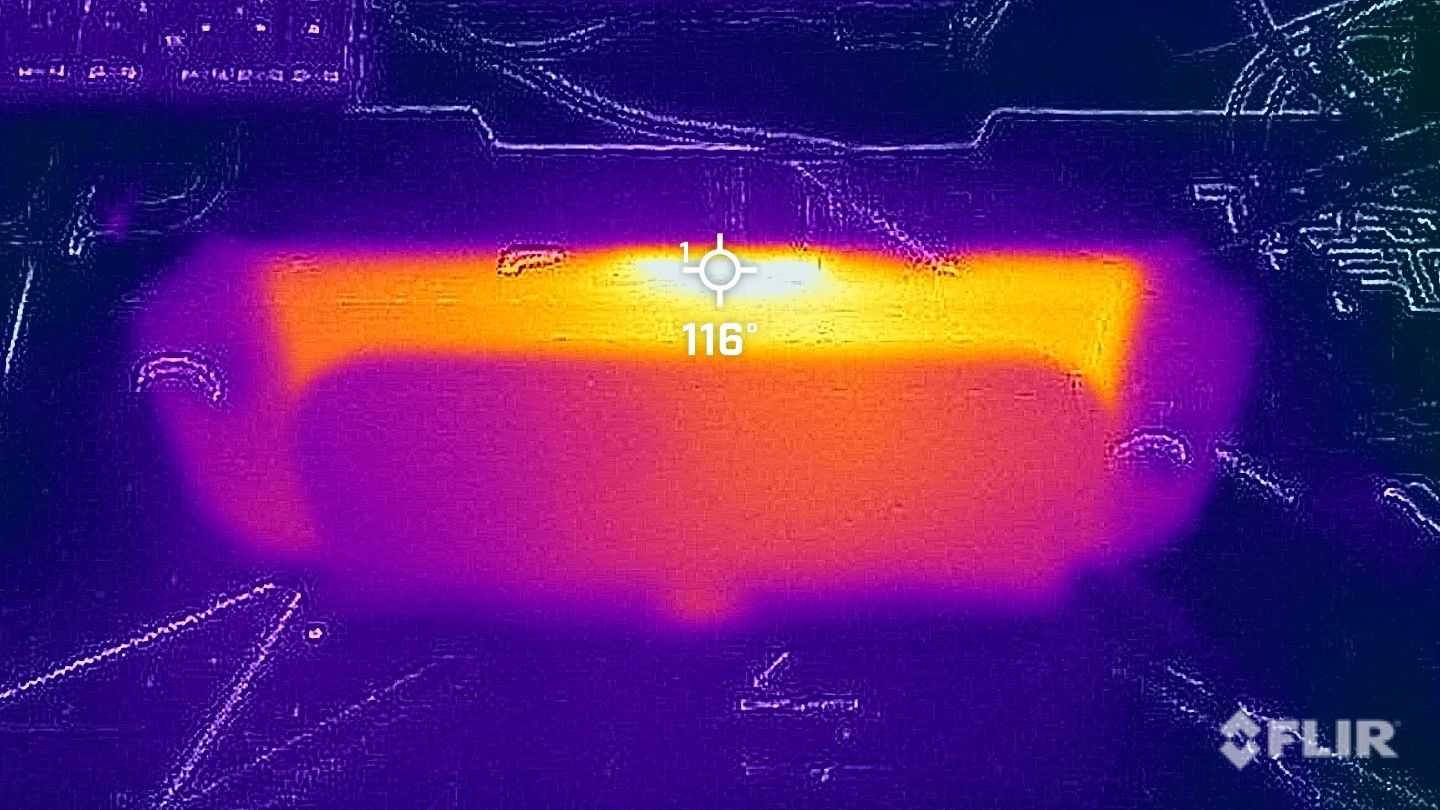
According to repair testing, "Nvidia mandates 107 degrees Celsius as the upper limit for RTX 50-series" and cards will drop clocks when the hotspot hits that point. This is why relying on average GPU temperature monitoring alone is risky: you might never see a problem until performance tanks. Hotspot data lets you spot issues like poor thermal interface material (TIM) application, uneven cooler pressure, or weak PCB design. In one case, the TIM had built up around the perimeter of the core while the center was mostly dry, leading to a 39-degree hotspot delta and immediate throttling. Enabling RTX 50 hotspot temperature monitoring gives you the visibility Nvidia’s default tools hide and turns troubleshooting into a quick tuning session instead of a full repair job.
Easiest Path: Using HWMonitor and Other Windows Tools
If you want RTX 50 hotspot temperature data with the least fuss, start with GPU temperature monitoring in HWMonitor. CPUID’s HWMonitor 1.65 adds support for Nvidia GeForce RTX 50-series GPU hotspot temperature monitoring, making it the first widely used Windows app to expose this sensor despite Nvidia’s locked public API. Once installed, it shows a dedicated "GPU HotSpot" reading for RTX 50 cards, separate from the lower average temperature Nvidia reports. That alone is enough to detect thermal throttling detection issues: you’ll see the hotspot climb toward 100–107°C even when the average stays in the 60s or 70s. It’s a good baseline before you dive into overlays or tuning tools.
Hotspot readings behave differently from the usual core temperature: a healthy card typically runs its hotspot around 10–20°C above the average GPU temperature. If you see a difference of more than 30°C, that strongly hints at poor heatsink contact, uneven mounting pressure, or degraded TIM. Recent reports involving an RTX 5070 Ti showed a 39-degree hotspot delta right before the card hit its thermal limit of 107°C and throttled, even though software still claimed an average of 67–68°C. That kind of gap is the warning flag you’re looking for. With HWMonitor RTX 50 support in place, other apps are catching up: upcoming versions of CapFrameX will support RTX 50 hotspot sensors and add a lightweight OSD, meaning in-game overlays for hotspot are about to become straightforward too.
- Download and install the latest HWMonitor version that adds RTX 50-series GPU HotSpot temperature support on your Windows system.
- Open HWMonitor and locate your RTX 50 GPU entry, then find the dedicated "GPU HotSpot" sensor alongside the lower average GPU temperature.
- Run a GPU load (3D game or benchmark) while watching both average temperature and hotspot; note the typical hotspot delta of 10–20°C and watch for deltas above 30°C that may indicate cooling problems.
Power-User Route: Unlocking Hotspot Access in MSI Afterburner
MSI Afterburner is still the favorite tool for GPU tuning and GPU temperature monitoring, but RTX 50 (RTX 5000-series) owners hit a roadblock: hotspot measurements are hidden from Nvidia’s public NVAPI interface, so Afterburner can’t show them by default. The developer has explained that this is a Nvidia decision, not a technical limitation in Afterburner, and that officially licensed builds avoid undocumented hardware access. However, there are workarounds. One option is to use a third‑party plugin that hooks hotspot data and passes it through to Afterburner and its OSD. Another, more advanced path is to unlock Afterburner’s low-level hardware interface so it reads RTX 50 hotspot values directly from GPU MMIO registers. That’s where you move from friendly GUI tweaking into manual configuration territory.
The low-level method borrows from Afterburner’s legacy RivaTuner-style command-line interface, originally meant for extreme overclockers and hardware manufacturers. Out of the box, this direct register access is only enabled for older Nvidia architectures, but you can extend it to RTX 50 GPUs by editing configuration files to treat them as supported hardware. Once unlocked, you can query the hidden hotspot sensor even though Nvidia keeps it out of NVAPI. This is powerful, but it comes with a warning: you’re bypassing the comfortable, documented layer and touching hardware registers directly. Mistakes won’t usually kill a card if you stick to read-only monitoring, but you should treat this like any low-level tool—double-check steps and keep backups of your config before experimenting.
- Install MSI Afterburner and ensure its files include the RTCore.cfg configuration used for low-level GPU access.
- Open RTCore.cfg and add your RTX 50 card’s PCI Device ID to the [GPU_10DE] section, which identifies Nvidia architectures that unlock direct low-level GPU access.
- Assign a valid internal GPU architecture ID (for example, G1B2, G111 or G123) to your entry so Afterburner treats the card as supported for register-level access, then save the file.
- Restart Afterburner and use its command-line interface or compatible plugin to read the hotspot sensor directly from GPU MMIO registers, verifying that hotspot temperature now appears for your RTX 50 card.
Deep Diagnostics: Using Nvidia MODS (If You Can)
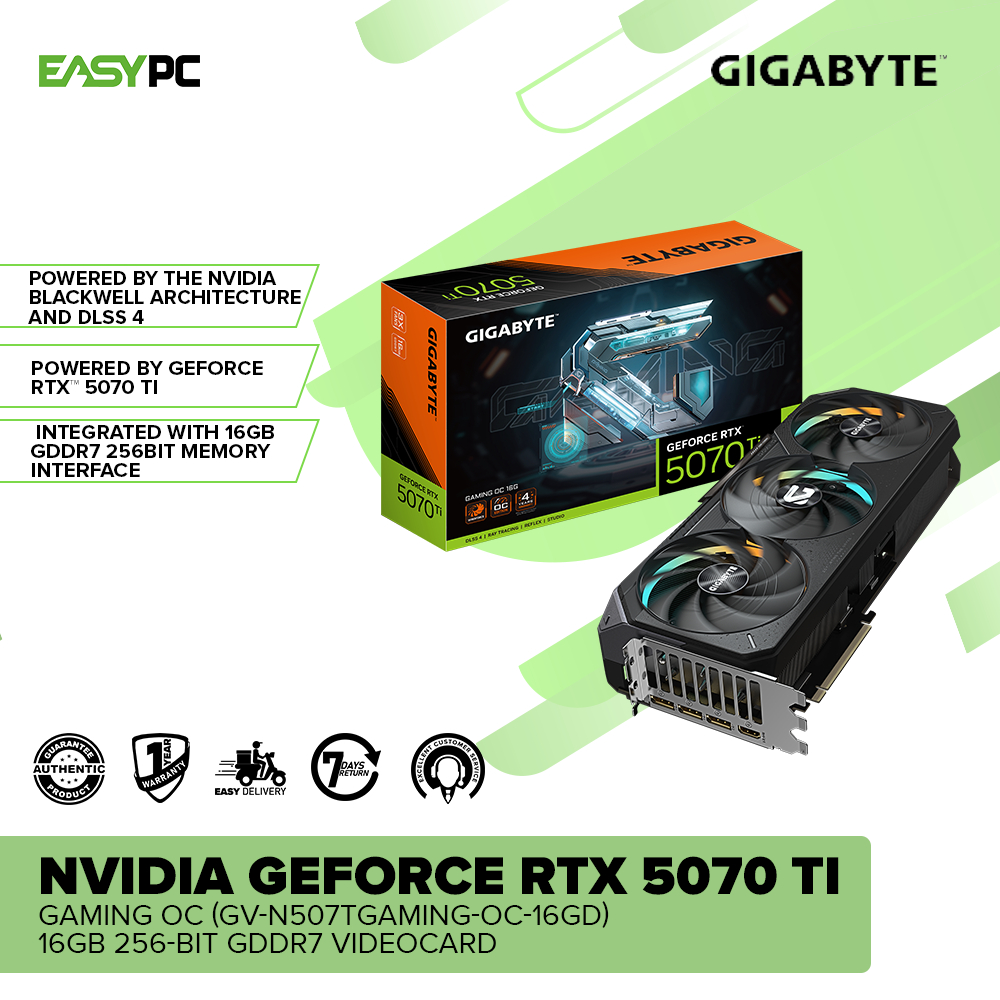
If you’re the sort of friend who ends up fixing everyone’s PCs, you might hear about Nvidia’s internal Modular Diagnostics Software, or MODS, as the ultimate way to view RTX 50 hotspot readings. MODS is an internal tool used to test GPUs before sale or during RMA, and it still has access to the hotspot sensor on Blackwell gaming GPUs. In one investigation, a Gigabyte RTX 5070 Ti that looked fine in Windows with 67–68°C average temperatures turned out to have a hotspot that shot straight to 107°C under load, triggering immediate throttling. MODS exposed that hidden sensor and made the issue obvious. The catch: "MODS is not available to the public and doesn’t work on Windows because the OS keeps intercepting calls from the hardware monitoring APIs". So while repair shops sometimes use it, it’s not a practical everyday option.
To run MODS, you need a Linux distribution that boots directly into a command line, providing an environment where MODS and its companion memory test MATS can talk to the GPU without interference. In this setup, the tool can monitor all aspects of the card, including the hidden hotspot sensor. That’s how technicians confirmed the RTX 5070 Ti was hitting Nvidia’s 107°C limit and throttling, then opened the card to inspect the physical problem: inadequate TIM application with paste pushed to the edges and a dry center. After removing the old material and applying a better paste, hotspot temperatures dropped to 100°C, which brought the card back into a safe operating range and stopped thermal throttling under load. MODS is overkill for most users, but it shows how valuable hotspot data is when diagnosing what averages can’t reveal.
- Prepare a Linux distribution that can boot directly to a command line without a desktop environment, suitable for running GPU diagnostic tools like MODS and MATS.
- Boot the system into this Linux environment and run MODS so it can access the RTX 50 GPU without Windows intercepting hardware monitoring API calls.
- Use MODS to read the hidden hotspot temperature sensor while the GPU is under load, comparing it with average temperatures to identify thermal throttling and cooling problems that standard Windows tools miss.
Reading Hotspot Results and Deciding What to Fix
Once you’ve enabled RTX 50 hotspot monitoring—through HWMonitor, MSI Afterburner tricks, or a diagnostic setup—the next step is interpretation. A sane RTX 50 hotspot temperature sits about 10–20°C above the average GPU temp; anything beyond that is your clue that something’s off with your cooling. When you see a hotspot racing up toward 107°C while the average stays below 70°C, you’re looking at hidden thermal throttling detection in action. That’s when you consider actions like re-seating the cooler, checking mounting pressure, or reapplying TIM with a proper even layer instead of a ring of paste around the core. In the documented RTX 5070 Ti case, fixing the bad TIM application dropped the hotspot from 107°C to 100°C and stopped throttling entirely, even though Nvidia’s average number never looked alarming.
The real takeaway is simple: hotspot monitoring turns vague performance drops into clear, fixable problems. What would have been a quick user-side TIM fix became a full repair job only because the GPU’s hotspot temperature was hidden and misreported to the owner. Now that HWMonitor RTX 50 support exists and MSI Afterburner can be persuaded into reading hotspot via plugins or low-level configuration, RTX 50 owners don’t have to fly blind anymore. Enable hotspot telemetry, learn what a healthy delta looks like on your card, and watch it when you change fans, cases, or overclocks. It’s a bit of effort upfront, but it protects your performance, keeps you ahead of thermal throttling, and saves you from chasing the wrong problem the next time your frame rates suddenly dip.