
Hotspot Monitoring: The New Baseline for Safe Performance
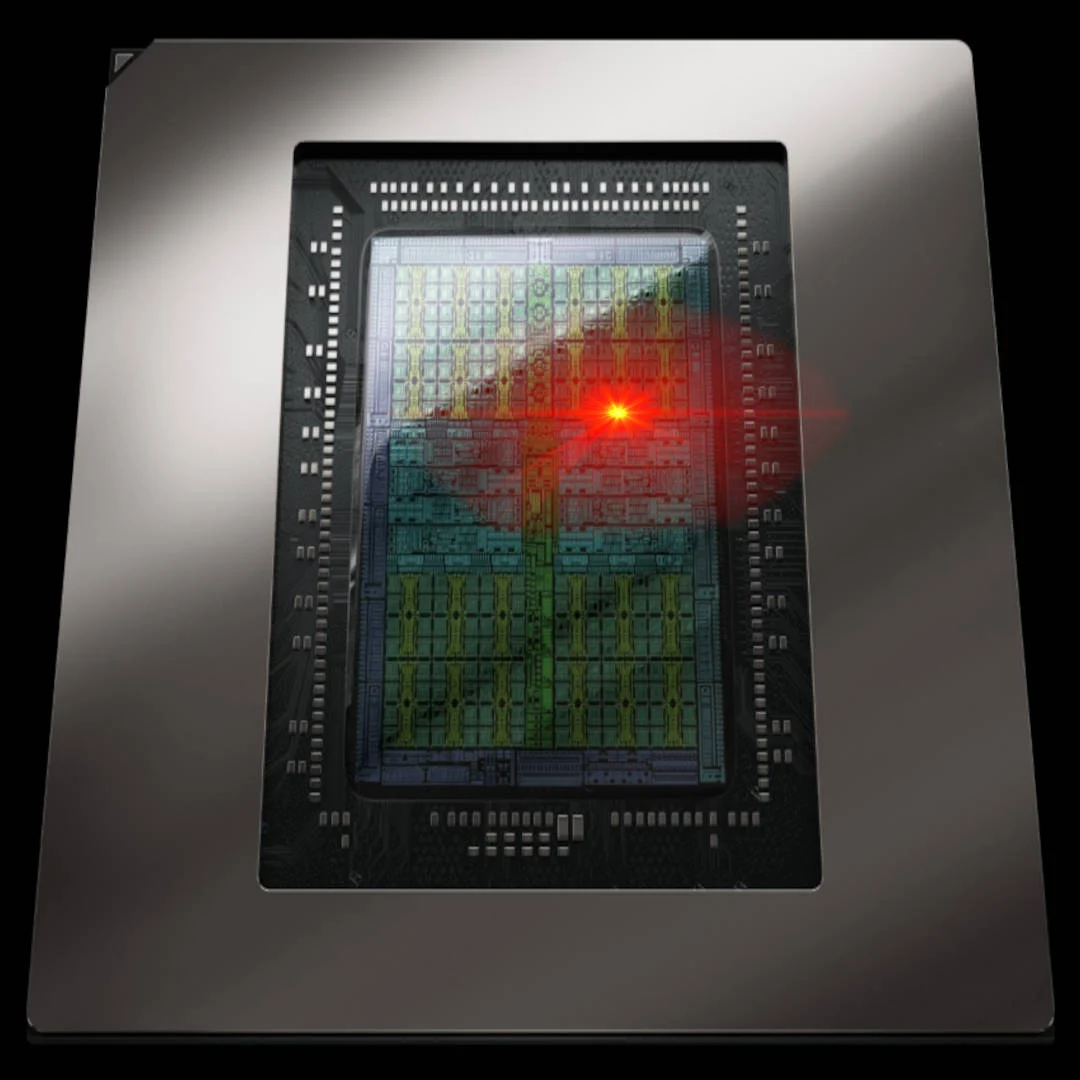
GPU hotspot temperature monitoring is the practice of tracking the single hottest point on a graphics processor die in real time, using PC hardware monitoring tools to reveal thermal imbalances, cooling problems, and hidden throttling risks that standard core temperature readings can miss, especially on modern high-power gaming cards and overclocked systems. This is no longer a luxury metric; it is the difference between guessing and knowing whether your RTX 50 series GPU is running safely. When you push power limits, tweak fan curves, or build compact systems, ignoring the hotspot number is like tuning a car while only watching average engine temperature. You might feel fine—right up until a hidden hot zone hits its limit and silently cuts performance. With hotspot data now unlocked in free tools, enthusiasts and DIY builders finally have the visibility that was previously reserved for factory diagnostic software.
HWMonitor 1.65: RTX 50 Hotspot Data Escapes the Factory
The big shift is simple: HWMonitor 1.65 puts RTX 50 hotspot temperature back in the hands of users. Nvidia’s Blackwell launch quietly removed hotspot access from public telemetry, so third-party apps had to drop it even though the sensor still existed on the silicon. In practice, that meant owners saw only the GPU core temperature while repair techs and internal tools kept the more revealing hotspot number. Hardware monitoring tools like HWMonitor are essential for anyone looking to maintain system stability and optimize performance; by tracking temperatures and voltages, users can prevent overheating or power-related problems that might cause crashes or damage components. Now that the RTX 50 hotspot is visible again in a free utility, the information gap is gone. According to one overclocker test, HWMonitor reported a hotspot of about 68°C with a conventional GPU temperature near 51°C on a shunt-modded RTX 5090 drawing more than 900 W from the wall. That 17°C spread is exactly the kind of detail you need when deciding if your cooling solution is truly under control.
HWiNFO: Deep Sensor Data for DIY Diagnostics
If HWMonitor is your quick thermal snapshot, HWiNFO is the full diagnostic dashboard. It focuses on expanding hardware compatibility and refining sensor monitoring across modern platforms, which makes it a natural fit for DIY builders who want to see everything their system is doing. Recent updates add support for the GeForce RTX 5060 and broader improvements for RTX 50-series GPUs, including reporting both maximum and rated GPU power limits for more detailed insight into power behavior. That matters when you are correlating hotspot temperatures with actual GPU power draw and limits, not guessing from a single number. HWiNFO also improves GPU sensor labeling, automatically distinguishing between integrated and discrete graphics, and tightens telemetry accuracy across CPU, memory, storage, and motherboard sensors. In short, it turns GPU thermal tracking into part of a complete system picture, where you can see how hotspot trends line up with power limits, fan speeds, and memory channels during heavy loads.
How to Use HWMonitor and HWiNFO for Real-Time Thermal Tracking
With hotspot access restored, the smart move is to build a monitoring routine around both HWMonitor and HWiNFO. Start by running HWMonitor 1.65 while gaming or stress testing; watch the GPU temperature and hotspot readings together to understand their typical difference under load on your RTX 50 card. A stable delta tells you your cooler and thermal paste are doing their job, while a growing gap hints at mounting issues that deserve attention. Then bring HWiNFO into the mix when you want deeper context: log maximum and rated GPU power limits alongside temperatures to see whether power ceilings or thermals are responsible when performance drops. Hardware monitoring tools like these handle CPU and GPU-level data, fan speeds, and more, so you can map out how your whole system responds to heavy workloads. The key is to treat hotspot tracking as a live metric, not a one-time check—leave these tools running during new build shakedowns, cooler swaps, and any overclocking session.
Why Real-Time Hotspot Data Belongs in Every Overclocking Plan
Overclocking without real-time hotspot data is performance roulette. When you raise voltages or power limits, conventional core temperature can stay within an acceptable range while a small region of the die quietly slams into its thermal ceiling and forces frequency or power throttling. Hardware monitoring tools are essential for anyone looking to maintain system stability and optimize performance because they show the temperatures and voltages that drive those limits. In extreme testing, an RTX 5090 with custom water cooling and a shunt mod pulled more than 900 W from the wall, and HWMonitor still reported a manageable hotspot around 68°C alongside a 51°C core. That kind of visibility lets enthusiasts validate that their loop, thermal paste application, and fan profiles are genuinely safe at chosen settings. For DIY builders, making hotspot monitoring part of your standard GPU thermal tracking is not optional—it is the fastest way to catch cooling problems and confirm stability before they turn into throttling, crashes, or long-term component stress.