
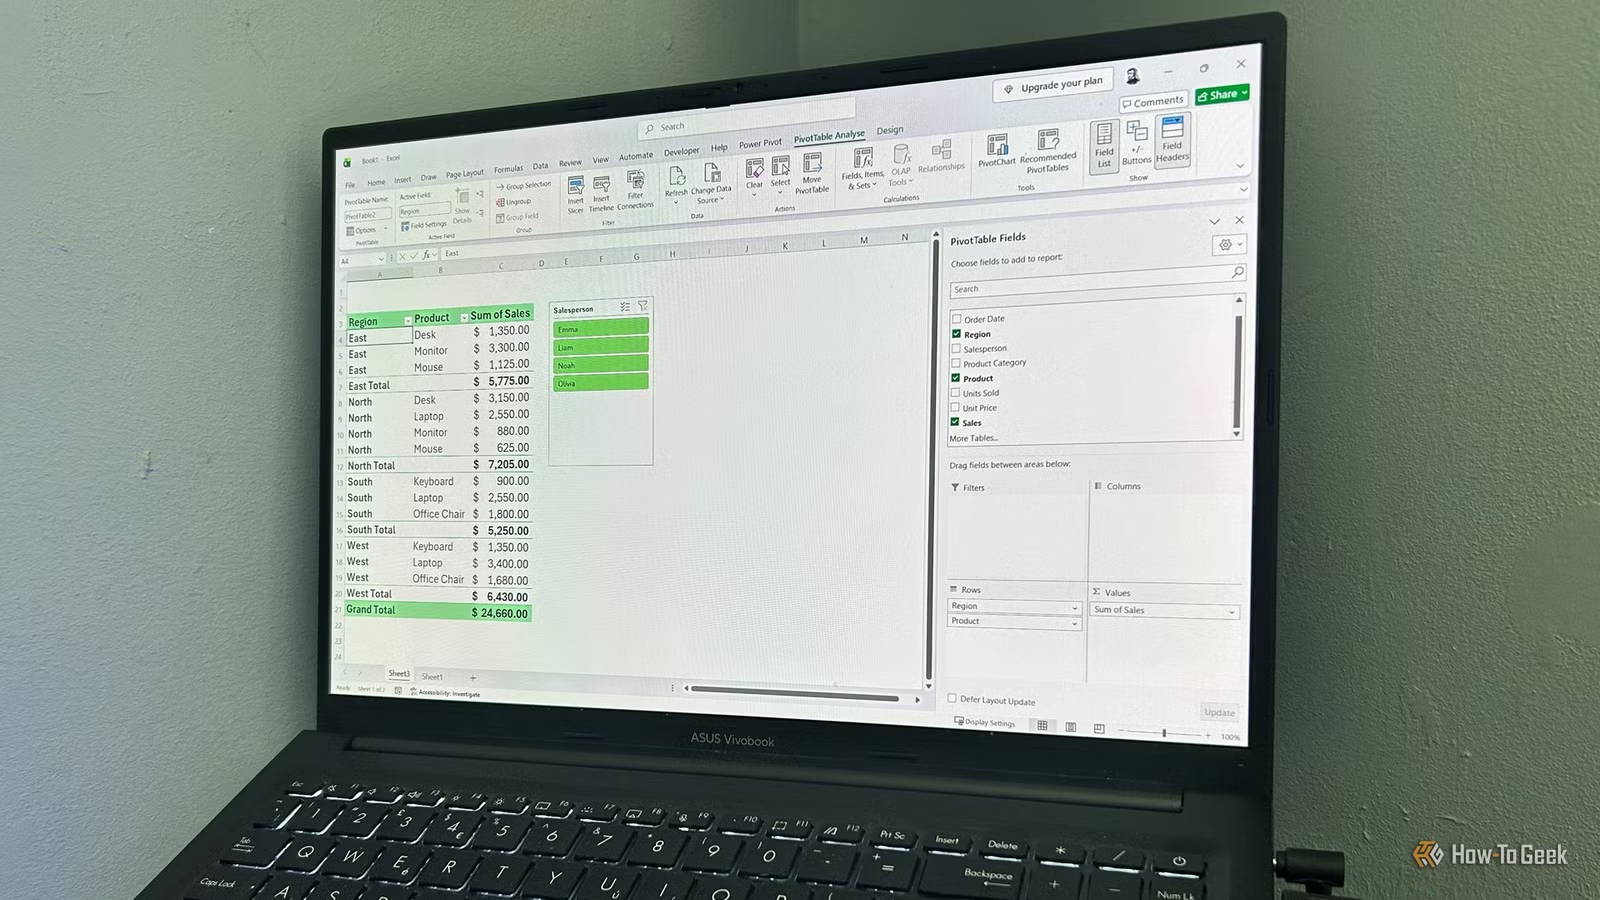

What a PivotTable Is and Why You Should Care
A PivotTable is an Excel tool that summarizes large, well-structured tables of data into compact reports using drag-and-drop fields instead of manual formulas, so you can rearrange your view of thousands of rows in seconds while keeping the original dataset untouched and intact.
If you’ve ever stared at a sheet with thousands of rows and thought, “I don’t have time to build all these formulas,” PivotTables are for you. PivotTables are drag-and-drop tools for summarizing data, letting you turn thousands of rows into clear, meaningful reports in minutes without changing the original spreadsheet. They are a powerful Excel formulas alternative when you need Excel data summarization but do not want to debug nested functions or maintain fragile references. The real prerequisite: your data must be in good shape. Every column should contain one type of information, every row a single record, with no blank rows and proper number and date formatting. If that sounds reasonable, you’re ready for a practical PivotTable tutorial.
Prepare Your Data: The Most Important Step
Before you create a PivotTable, you need clean source data in a proper tabular layout. Every column should contain one type of information, such as Date, Product, Region, or Sales, and every row should represent a single record. This structure is what allows Excel to summarize large datasets reliably and prevents hard‑to‑trace errors later. A common mistake is mixing data types in one column or inserting blank rows; both can break summarization.
Next, convert your raw range into an Excel table. Select any cell in the dataset, and on the Home tab click "Format as Table" and choose a style. When the dialog box appears, make sure "My table has headers" is checked, then click "OK". Checking this box is vital; forgetting it is one of the most frequent gotchas because PivotTables rely on unique column headers. Tables expand automatically when you add new rows, so refreshing your PivotTable later will pick up new data without rebuilding your layout. This one-time setup makes every future report easier.

Step-by-Step: Build Your First PivotTable
With your data in an Excel table, you can build a PivotTable that summarizes large datasets with almost no formulas. Think of this as rearranging field labels rather than writing functions. Follow the sequence below once, and you’ll reuse it on any similar dataset.
- Select any cell inside your Excel table so Excel knows which dataset to use.
- Go to the Insert tab and click the top half of the PivotTable button to start the PivotTable wizard.
- Choose whether to place the PivotTable in a new worksheet or an existing one; many people prefer New Worksheet to keep source data and analysis on separate sheets.
- Click OK to create a blank PivotTable layout linked to your table.
- In the PivotTable Fields pane, drag a categorical field (for example, Region or Product) into the Rows area so it lists down the left side.
- Drag another categorical field into the Columns area if you want a matrix-style view across the top.
- Drag a numeric field (such as Sales or Quantity) into the Values area so Excel calculates sums or counts for each row/column combination automatically.
- Optionally drag a field into the Filters area to add a dropdown filter above the PivotTable for quick high-level filtering.
As you drag fields into Rows, Columns, Values, and Filters, the PivotTable updates instantly. You can even drag the same numeric field into Values twice and change one to show a sum and the other to show an average using Value Field Settings. This is where PivotTables shine as an Excel formulas alternative, because you can uncover more insights without creating additional formulas or reports. If the layout is not what you expected, remove fields by dragging them out of an area or using Remove Field, then try a different arrangement until the report tells the story you need.
Avoid Common PivotTable Pitfalls
Most PivotTable problems trace back to data quality rather than the PivotTable itself. The first major mistake is using inconsistent column headers or leaving some columns blank. Every column needs a unique header so Excel can list them clearly in the PivotTable Fields pane. The second common issue is leaving blank rows in the middle of the dataset; these can make Excel think your data stops early, causing missing records in your summaries.
Formatting also matters. You need dates stored as dates and numbers stored as numbers; if you have dates as text or numbers mixed with text, totals and groupings can be wrong or incomplete. When you convert your range to a table, always check "My table has headers" so Excel does not treat the first data row as a header row. According to the article on converting ranges to Excel tables, this single checkbox is easy to overlook but essential for charts and summaries to work correctly. Spending a few minutes fixing these issues up front will save you from hours of confusing PivotTable results later.
What You Get When Everything Works
Once you understand the basics, you can turn thousands of rows into clear, meaningful reports in minutes while exploring your data without ever changing the original spreadsheet. This is Excel data summarization at its best: drag-and-drop fields, instant totals, and different views of the same dataset without touching a single SUMIF or VLOOKUP. PivotTables are drag-and-drop tools for summarizing data, so you can summarize large datasets in a few clicks instead of building and maintaining complex formulas.
You’ll notice a similar benefit if you’ve ever built a timeline chart from a table: when the underlying table changes, the chart updates automatically. And that’s it—your timeline is complete, and if you add, remove, or change the dates in the original table, the chart will update to reflect those amendments. PivotTables behave the same way when connected to a well-structured Excel table: refresh the PivotTable, and your summarized view reflects the latest rows without any layout rebuild. The takeaway: if you invest a little effort in the table and fields now, PivotTables will give you fast, reliable summaries you can reshape any time you need.